Imaging


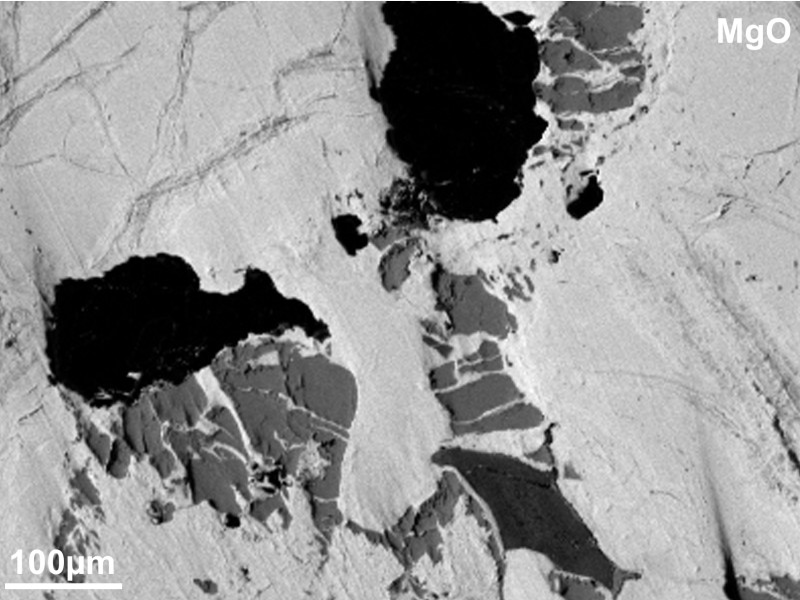
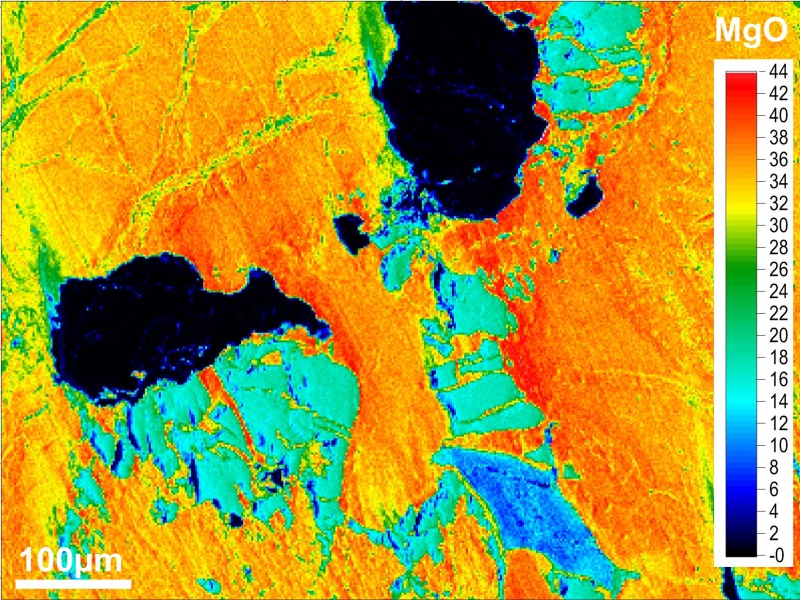
Secondary electron (SE), backscattered electron (BSE), characteristic X-ray, and cathodoluminescence (CL) signals are used to produce images of different information content. By moving the electron beam, or the sample, images can be acquired, processed, and stored digitally. They can be displayed in either grayscale or false color, depending on the scientific question.
 
Electron images
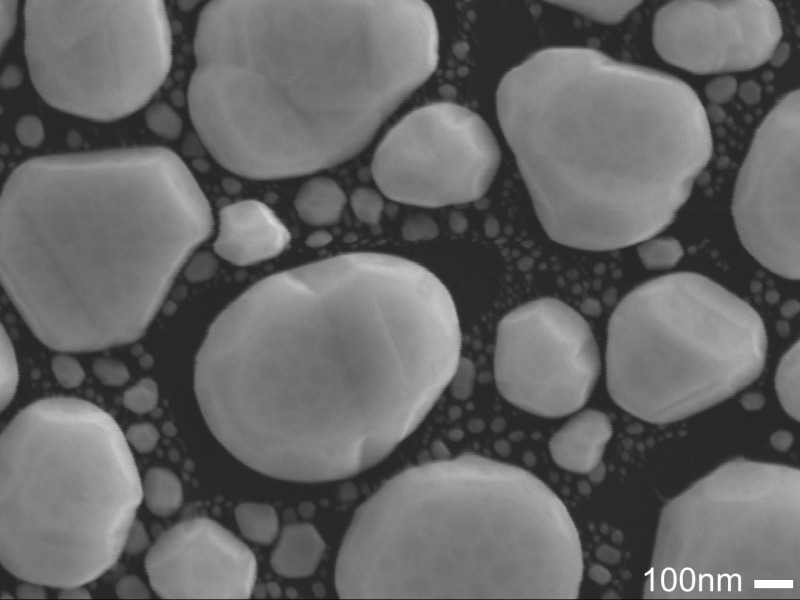
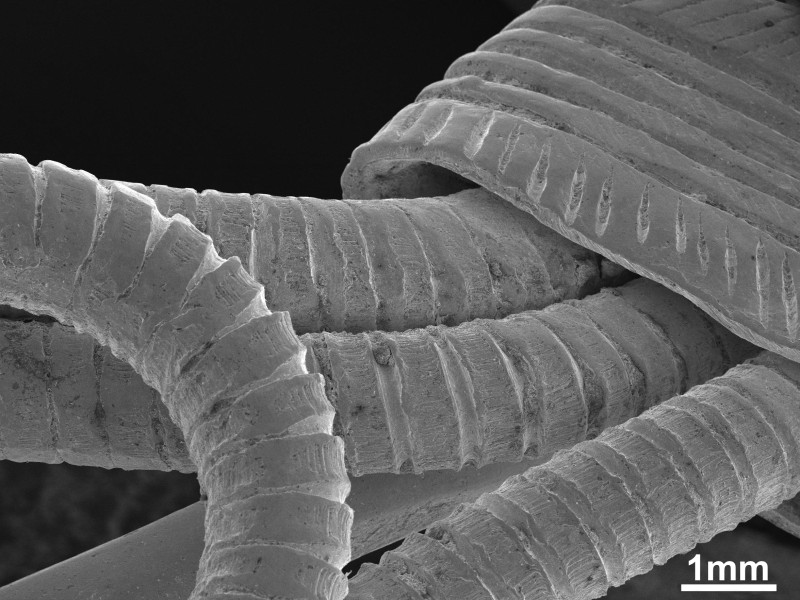
SE imaging provides topographic information of a sample. The spatial resolution for SE imaging is approximately 100 to 200 nm, depending on the accelerating voltage, beam current, and other operating conditions. Common applications include studies of grain morphology, precipitates on a mineral surface, microfossils, biological as well as anthropological samples and other materials too small for visible light microscopy.

High-resolution SE image of gold grains on carbon to highlight the instrumental resolution: Close-up of several bright gold grains of varying sizes on a dark surface; scale bar at lower right. (AI-generated alt-text, generated with GPT-4.1-mini)
High-resolution SE image of gold grains on carbon to highlight the instrumental resolution
SE image of ancient gold jewelry from Arikogel (Austria): Filigree metalworking 3000 years old.: SEM image of gold spiral wire with regular grooves, part of prehistoric jewelry from Arikogel. (AI-generated alt-text, generated with GPT-4.1-mini)
SE image of ancient gold jewelry from Arikogel (Austria): Filigree metalworking 3000 years old.

BSE images show atomic number differences within a sample. A certain fraction of electrons of the primary beam are scattered, "backward" out of the sample after interaction with the sample and can be used for imaging. The number of electrons which are backscattered increases with increasing mean atomic number of the material. From this follows that: the brighter the phase, the heavier the mean atomic mass of that material.

BSE picture of various mineral phases from the Lengenbach quarry (Switzerland): searching for new minerals.: Black-and-white BSE micrograph of different mineral phases with contrasting lines and areas; scale bar at lower left. (AI-generated alt-text, generated with GPT-4.1-mini)
BSE picture of various mineral phases from the Lengenbach quarry (Switzerland): searching for new minerals.
BSE picture of worm-like intergrowth of three mineral phases (white-ecrinsite, light gray-stibnite and dark gray-smithite, the discovery of a new mineral (ecrinsite).: Black-and-white BSE image showing worm-like intergrowths of different mineral phases: white Ecrinsite, light gray Stibnite, and dark gray Smithite. (AI-generated alt-text, generated with GPT-4.1-mini)
BSE picture of worm-like intergrowth of three mineral phases (white-ecrinsite, light gray-stibnite and dark gray-smithite, the discovery of a new mineral (ecrinsite).
X-ray mapping
The combination of scanning of the specimen surface by the primary electron beam with simultaneous detection of X-rays produces so called elemental maps. Variation in selected element distributions are shown in grey- or false color-coding levels, at a spatial resolution of one micron. Such maps can reveal features not normally observed in BSE images. Our lab offers fully quantitative (background- and interference-corrected, fully calibrated) element mappings based on a unique combination of a Bruker EDS system with the ProbeImage software and Probe for EPMA software.

Element distribution map in grayscale for magnesium in a basalt, showing the distribution of a selected element in the rock. The brightness of the gray value corresponds to the magnesium content.: Black-and-white elemental distribution map of basalt with irregular, variously bright areas. Bright zones indicate magnesium-rich regions, dark areas are magnesium-poor. (AI-generated alt-text, generated with GPT-4.1-mini)
Element distribution map in grayscale for magnesium in a basalt, showing the distribution of a selected element in the rock. The brightness of the gray value corresponds to the magnesium content.
Quantitative false color-coded element distribution map for magnesium in a basalt. Colors refer to wt% oxid, showing the distribution of a selected element in the rock.: Color map of a basalt cross-section with irregular zones in orange, yellow, green, and blue. At right, a color scale for magnesium content from 8 to 44. Bright areas indicate high, dark areas low magnesium concentration. (AI-generated alt-text, generated with GPT-4.1-mini)
Quantitative false color-coded element distribution map for magnesium in a basalt. Colors refer to wt% oxid, showing the distribution of a selected element in the rock.
  
Ticket Shop